CodaBench page: https://www.codabench.org/competitions/3306/
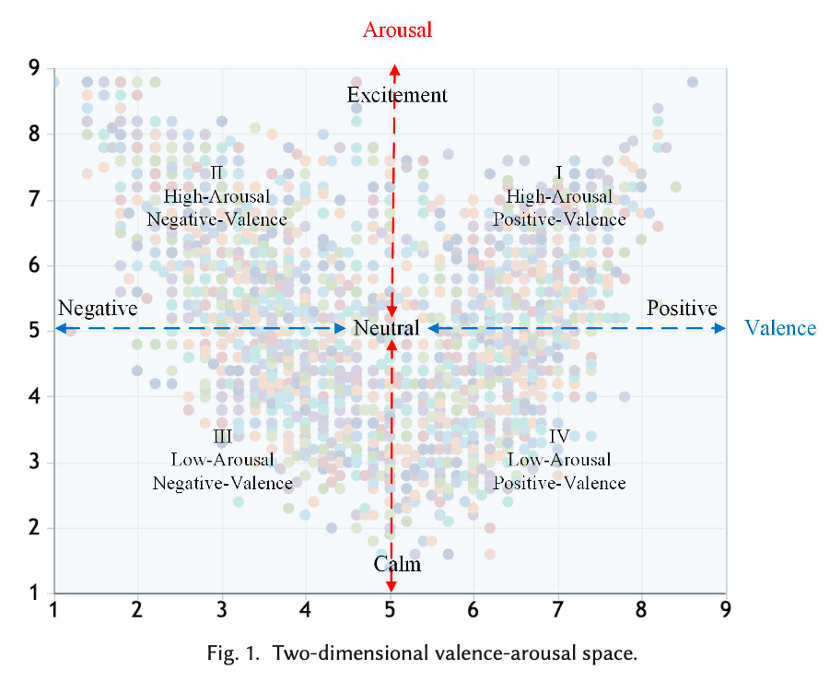
Sentiment analysis has emerged as a leading technique to automatically identify affective information within texts. In sentiment analysis, affective states are generally represented using either categorical or dimensional approaches (Calvo and Kim, 2013). The categorical approach represents affective states as several discrete classes (e.g., positive, negative, neutral), while the dimensional approach represents affective states as continuous numerical values on multiple dimensions, such as valence-arousal (VA) space (Russell, 1980), as shown in Fig. 1. The valence represents the degree of pleasant and unpleasant (or positive and negative) feelings, and the arousal represents the degree of excitement and calm. Based on this two-dimensional representation, any affective state can be represented as a point in the VA coordinate plane by determining the degrees of valence and arousal of given words (Wei et al., 2011; Malandrakis et al., 2013; Wang et al., 2016; Du and Zhang, 2016; Wu et la., 2017; Yu et al., 2020; Deng et al., 2022) or texts (Kim et al., 2010; Paltoglou et al, 2013; Goel et la., 2017; Zhu et al., 2019; Wang et al., 2019; 2020; Deng et al., 2023).
The first dimensional sentiment analysis (DSA) task for Chinese words (Yu et al., 20216) was organized at the IALP 2016 conference. The second edition of DSA task was organized at the IJCNLP 2017 conference to include both Chinese words and phrases (Yu et al., 2017). The third edition was organized at the ROCLING 2021 conference to explore the sentence-level dimensional sentiment analysis task on educational texts (students’ self-evaluated comments) (Yu et al., 2021). This year, we organize the fourth edition of DSA task to analyze medical multi-sentence texts (doctors’ self-reflection feelings).
Dimensional sentiment analysis is an effective technique to recognize the valence-arousal ratings from texts, indicating the degree from most negative to most positive for valence, and from most calm to most excited for arousal. In this task, participants are asked to provide a real-valued score from 1 to 9 for both valence and arousal dimensions for each doctors’ self-reflection texts. The input format is “ID, texts”, and the output format is “ID, vallence_rating, arousal_rating”. Below are the input/output formats of the example sentences.
Input: ex01, 主治醫師曾經多次強調血液透析和輸血,以病人的狀況就是不建議,已經在加護病房積極治療了兩個禮拜,家屬却遲遲無法達到共識。
Output: ex01, 4.750, 2.750
Input: ex02, 視病如親,這個成語一直是一個難以達成的理想,但在ICU我感受到醫療端與病人和家屬站在同一陣線、共同努力對抗病魔,完成病人的願望的努力,讓我十分的動容。
Output: ex02, 6.900, 5.600
http://nlp.innobic.yzu.edu.tw/resources/ChineseEmoBank.html
The Chinese EmoBank (Lee et al., 2022) is a dimensional sentiment resource annotated with real-valued scores for both valence and arousal dimensions. The valence represents the degree of positive and negative sentiment, and arousal represents the degree of calm and excitement. Both dimensions range from 1 (highly negative or calm) to 9 (highly positive or excited). The Chinese EmoBank features various levels of text granularity including two lexicons called Chinese valence-arousal words (CVAW, 5,512 single words) and Chinese valence-arousal phrases (CVAP, 2,998 multi-word phrases) and two corpora called Chinese valence-arousal sentences (CVAS, 2,582 single sentences) and Chinese valence-arousal texts (CVAT, 2,969 multi-sentence texts).
There are 994 doctors' self-reflection texts for system development.
We will provide at least 1,500 doctors’ self-reflection texts for system performance evaluation.
The performance is evaluated by examining the difference between machine-predicted ratings and human-annotated ratings (valence and arousal are treated independently). The evaluation metrics include: Mean Absolute Error (MAE) and Pearson Correlation Coefficient (PCC) , defined as follows
$$ MAE = \frac{1}{n} \sum_{i=1}^{n}|a_{i}-p_{i}| $$
$$ PCC = \frac{1}{n-1} \sum_{i=1}^{n}(\frac{a_{i}-\mu_{A}}{\sigma_{A}})(\frac{p_{i}-\mu_{P}}{\sigma_{P}}) $$
where \( a_{i}\in{A} \) and \( p_{i}\in{P} \) respectively denote the i-th actual value and predicted value, n is the number of test samples, and \( \mu_{A} \) and \( \sigma_{A} \) respectively represent the mean value and the standard deviation of A, while \( \mu_{P} \) and \( \sigma_{P} \) respectively represent the mean value and the standard deviation of P.
The actual and predicted real values range from 1 to 9, so MAE measures the error rate in a range where the lowest value is 0 and the highest value is 8. A lower MAE indicates more accurate prediction performance. The PCC is a value between −1 and 1 that measures the linear correlation between the actual value and the predicated value. A lower MAE and a higher PCC indicate more accurate prediction performance. Each metric for the valence and arousal dimensions is ranked independently. A model’s overall ranking is computed based on the mean rank across the four metrics. The lower the mean rank, the better the system performance.
Notes: Each metric in individual subtask is ranked independently. (*) means the rank for each metric. A system’s overall ranking is computed based on the mean rank. The lower the mean rank, the better the system performance.
| Team | Evaluation Metrics | Overall Rank | |||
| V-MAE | V-PCC | A-MAE | A-PCC | ||
| CYUT-NLP | 0.46 | 0.78 | 0.74 | 0.63 | 1 |
| TCU | 0.46 | 0.81 | 0.76 | 0.61 | 2 |
| ntulaw | 0.5 | 075 | 0.79 | 0.59 | 3 |
| SCU-NLP | 0.51 | 0.76 | 0.87 | 0.59 | 4 |
| Monokeros | 0.53 | 0.76 | 0.82 | 0.58 | 5 |
| Hey Vergil | 0.63 | 0.62 | 1.01 | 0.21 | 6 |